This section explains how to get log information from the Tangara, and how to enable additional logs for debugging.
Reading the log output
Using ESP-IDF Monitor
The best way to read the log output is using the ESP-IDF Monitor tool with a local development build of Tangara's firmware. This provides some helpful features like resolution of stack trace addresses, shortcuts to reflash or restart the device, and more. By having a local firmware build it is also possible to enable more comprehensive logging.
See BUILDING.md in the tangara-fw repository on Codeberg for documentation on how to get a local firmware build.
Using another serial terminal
If for whatever reason you cannot or don't want to have a local build of the firmware, it's still possible to get log output over serial. Although keep in mind that if you are using a release build of the Tangara firmware, only error and warning logs will be included. This can still be useful for debugging certain types of errors, or debugging via the serial console.
On Linux and MacOS, you can use the screen program from the command line. Plug your tangara into the computer using a USB-C cable, and check for the serial device file that gets created in /dev/. On MacOS this usually looks like /dev/tty.usbmodem*, and on Linux it might look like /dev/ttyUSB*. Once you've determined which port your Tangara is connected on, you can run screen [device] [baud rate], ie screen /dev/tty.usbmodem 115200. Tangara communicates with a baud rate of 115200, so be sure to set that or the output may not work correctly.
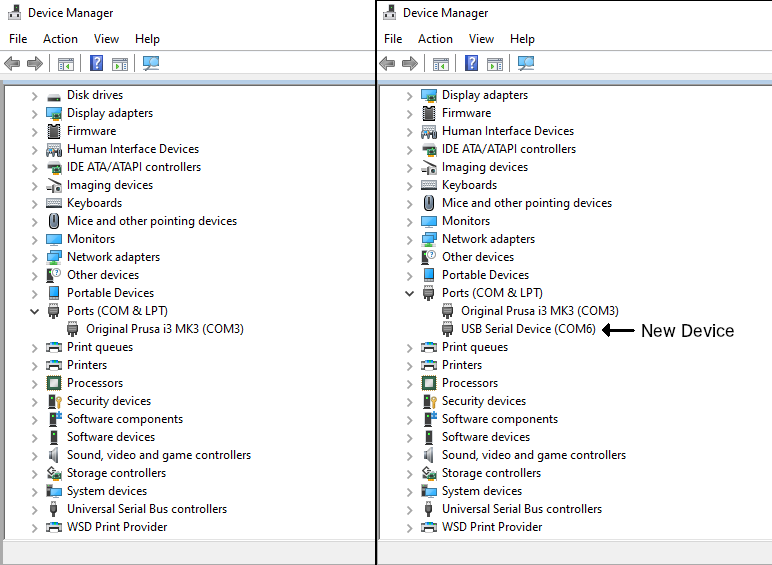
On Windows, you can use PuTTY. Once PuTTY is installed, open the Device Manager and take note of the devices under "Ports (COM & LPT)". Plug the Tangara in using a USB-C cable, and you should see a new device with a COM port show up.
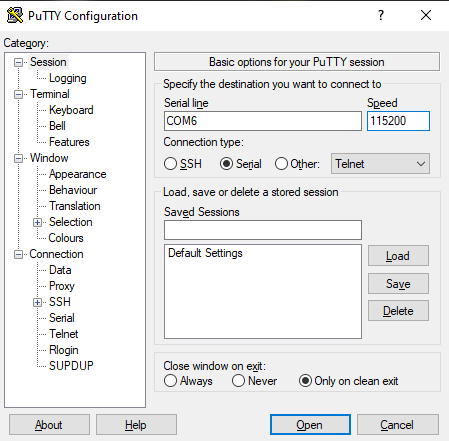
Then open up PuTTY and select Serial for the connection type. Replace the serial line with the COM port from the previous step, and change the speed to 115200. Then click the Open button in the bottom right to start the serial terminal.
In both cases, you should see the text 'Press any key to enter dev console'. Pressing any key will enter the dev console, which allows for some useful developer commands, but will suppress log output whilst it's in that mode. If you see no output, or the output looks like a prompt (-->), it's possible that the Tangara is already in this mode. Whilst in the dev console, you can enter help to show a list of commands. If you want to enable logging again after entering the dev console, you can do so with the loglevel command. Ie, loglevel WARN will allow logs up to level WARN to be displayed. Though setting this value to higher log levels than are included in the build will not cause those to be shown. To enable more verbose logging, see the next section.
Enabling debug logging
By default, release builds and the default firmware configuration only include log levels up to WARN. To enable more verbose logging, use the idf.py menuconfig tool, and navigate to Component config -> Log ouput -> Default log verbosity, and set this to your target log level. The log levels available are:
- Error (Lowest)
- Warn
- Info
- Debug
- Verbose (Highest)
After setting this option, rebuild and reflash the firmware to include these new logs. Some components in the firmware are particularly log-heavy at higher log levels, and may slow down the device. To avoid this issue and still get higher verbosity logs from other components, you can instead set the maximum default log level to something higher to include those logs in the compiled firmware, then use the loglevel [tag] [level] console command to set the log level for the tag(s) you're interested in.